Date: Every day I forget to drink water
As an IT specialist, I’ve got dashboards for everything: CPU load, network traffic, whether the coffee machine is still pingable… But after years of keeping systems running at 99.999% uptime, I realized one thing was running at 0.001% stability: me.
So I did what any self-respecting sysadmin would do—I made a metric-based daily log for my meat suit. Think of it like Zabbix, but for my brain.
🔑 Core Metrics: Because I Need Monitoring Too
Here’s how I rate myself each day (1–10 scale, just like I rate vendor support):
- Productivity – Did I get things done, or did I just reorganize my folders and call it progress?
- Happiness – Did I smile today, or did I curse at YAML files again?
- Energy – Was I a fully-charged SSD or a dying AA battery from a 2003 TV remote?
- Focus – Did I deep-dive into tasks or get lost in a Wikipedia rabbit hole about penguins?
- Stress (inverted) – 10 = Zen monk. 1 = PagerDuty went off while I was in the bathroom.
- Social Fulfillment – Did I talk to a human not named “Alexa”?
- Confidence / Self-Respect – Did I follow my values, or just give up and eat cold pizza?
You can also enable Bonus Logging Mode™ for:
- Sleep Quality – Not just hours, but whether I woke up feeling like a champion or a cave troll.
- Intentionality – Did I drive my day, or did I just ride along like a lost packet?
- Long-Term Progress – Did today push me closer to my goals, or just into another rabbit hole of bash scripting?
🧪 Daily Log Example
[June 10, 2025]
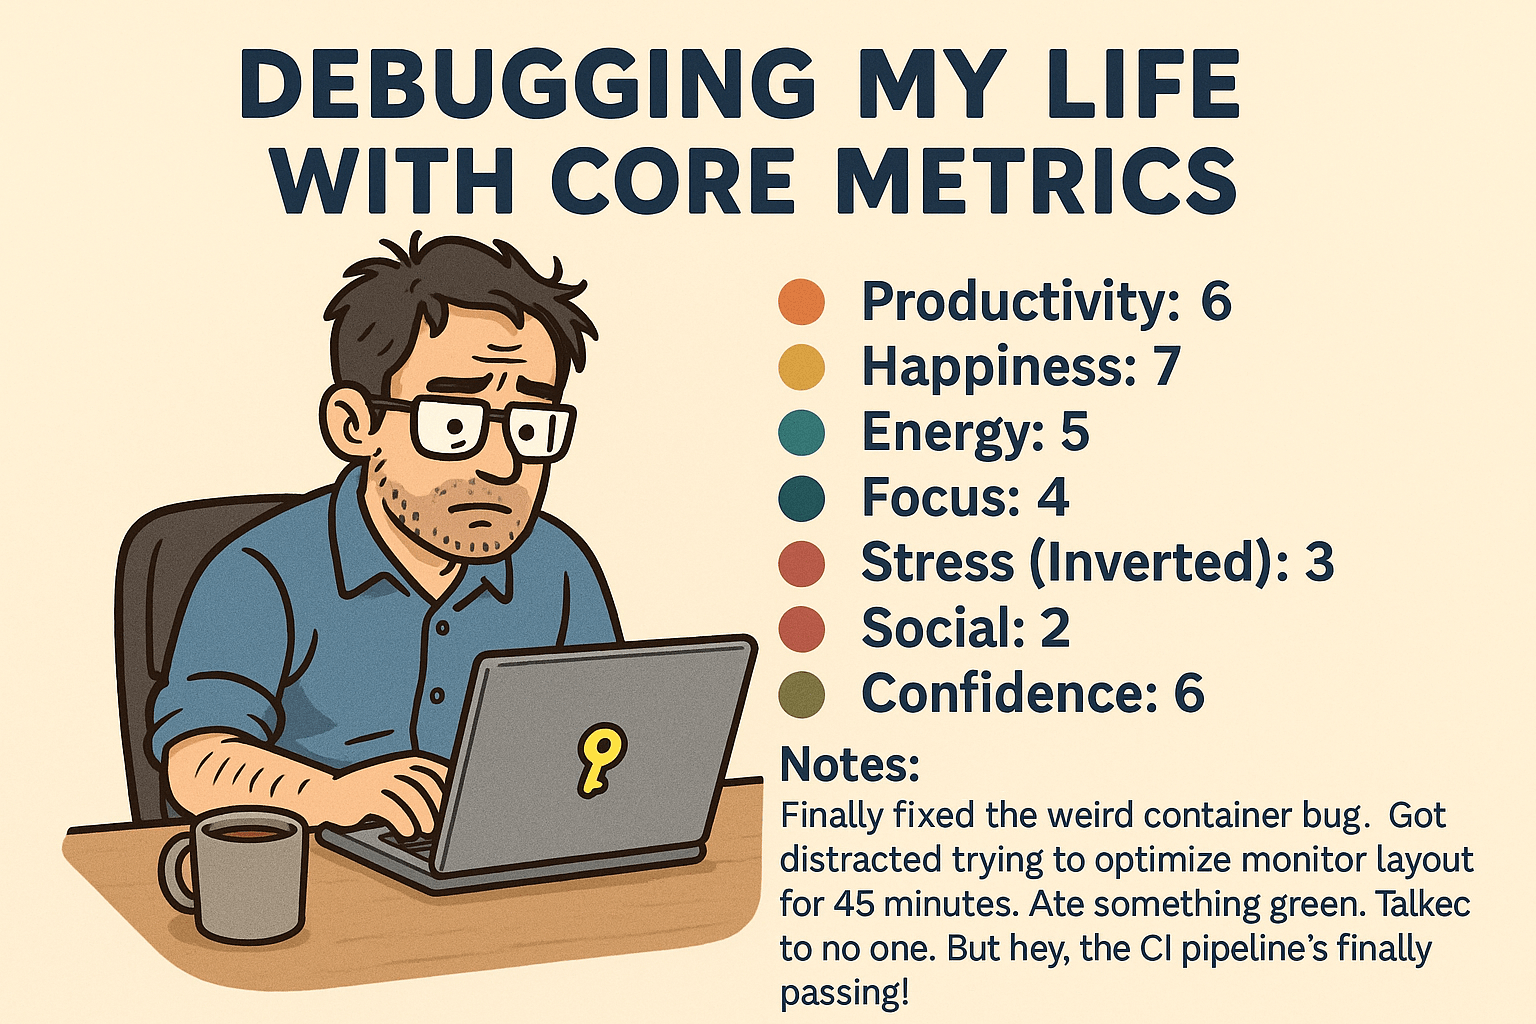
Productivity: 6
Happiness: 7
Energy: 5
Focus: 4
Stress: 3
Social: 2
Confidence: 6
Sleep: 6
Intentionality: 7
Long-Term Progress: 5
Notes: Finally fixed the weird container bug (victory!). Got distracted trying to optimize my monitor layout for 45 minutes. Ate something green. Talked to no one. But hey, the CI pipeline’s finally passing!
Average score: 5.6 – not bad, but definitely needs a patch.
📈 Why This Is Better Than Therapy (Almost)
- Low focus + high stress = code spaghetti
- Seeing friends = 2X happiness, 1.5X energy (buffer overflow of serotonin)
- High energy days = God-mode productivity, even answered that one Jira ticket from 2021
It’s like Grafana for your soul. You stop guessing what’s wrong and start seeing it.
🧠 The Big Realization
The day I noticed my energy was always low after lunch, I stopped blaming the chair and started blaming the three churros and Mountain Dew. The day I saw that social fulfillment was always a 2, I messaged a friend. That helped.
I can optimize Linux. Now I’m learning to optimize me.
💾 Final Thoughts
You monitor your servers. You check your backups. Why not monitor your own operating system?
I run this log daily now. It’s a silly little text file, but it’s helped me stay in touch with myself more than any smartwatch or motivational poster ever has.
Start logging your metrics. You might just discover that the mainframe you needed to reboot… was you.
Now excuse me, I need to go update my personal uptime SLA.
Want a copy of my template? Ping me below or fork the repo on GitSelfCareHub.com 😅
Got it! Here’s the corrected Author Spotlight section to replace the previous one:
👨🔬 Author Spotlight: Declan Erickson
Declan Erickson is a physics and engineering student at Holy Cross College with a passion for both hard science and human systems. When he’s not calculating forces or debugging circuits, he’s reflecting on how to engineer a better daily routine—using metrics, mindfulness, and just the right amount of sarcasm.
Fun Fact: He once reverse-engineered his coffee habit using spreadsheets and ended up inventing a new productivity scale. (It’s mostly caffeine-based.)